When it comes to performing calculations and analysis in Excel, there are numerous functions that can save you time and effort and one of these is the SUMPRODUCT function.
In this blog post, we'll dive into what the SUMPRODUCT function is, how it works, and provide a step-by-step guide on how to create a SUMPRODUCT formula in Excel using examples.
- Understanding the SUMPRODUCT Function in Excel
- Advantages of Using SUMPRODUCT in Excel
- Calculating Total Cost Price using the SUMPRODUCT function in Excel
- Create a SUMPRODUCT formula using the Function Arguments box to calculate the Sales Price
- Calculating the difference between Cost Price and Sales Price
- SUMPRODUCT formula in Excel: Example 1
- SUMPRODUCT formula in Excel: Example 2
Understanding the SUMPRODUCT Function in Excel
The SUMPRODUCT function might not be as commonly used as some of the more popular functions in Excel, but it's an incredibly handy tool when dealing with complex calculations that involve multiple arrays of data.
This function is designed to perform the sum of the products of corresponding values in arrays or ranges. In other words, it allows you to multiply values from different ranges and then sum up the results of those multiplications.
Doing this not only saves you a lot of time but it can save so much space on a worksheet. This is because it eliminates the need for you to have total columns for each set of data.
Advantages of Using SUMPRODUCT in Excel
Using the SUMPRODUCT function offers several advantages:
- No Need for Intermediate Columns: Unlike traditional methods that might require additional columns to store intermediate calculations, SUMPRODUCT lets you perform calculations directly without cluttering your spreadsheet.
- Efficient Data Analysis: When dealing with large datasets, SUMPRODUCT helps you efficiently perform calculations across multiple arrays, saving time and resources.
- Simplicity: Once you understand the concept, creating SUMPRODUCT formulas is straightforward and doesn't require extensive Excel expertise.
Calculating Total Cost Price using the SUMPRODUCT function in Excel
Let's consider a scenario where you have a dataset containing information about sales, including the cost price and the quantity sold for each item. Traditionally, you might be inclined to create an additional column to calculate the total cost for each row before finding the overall total. However, SUMPRODUCT can help you achieve this without the need for extra columns.
Here's how you can use the SUMPRODUCT function to calculate the total cost price for all sales in the given dataset:
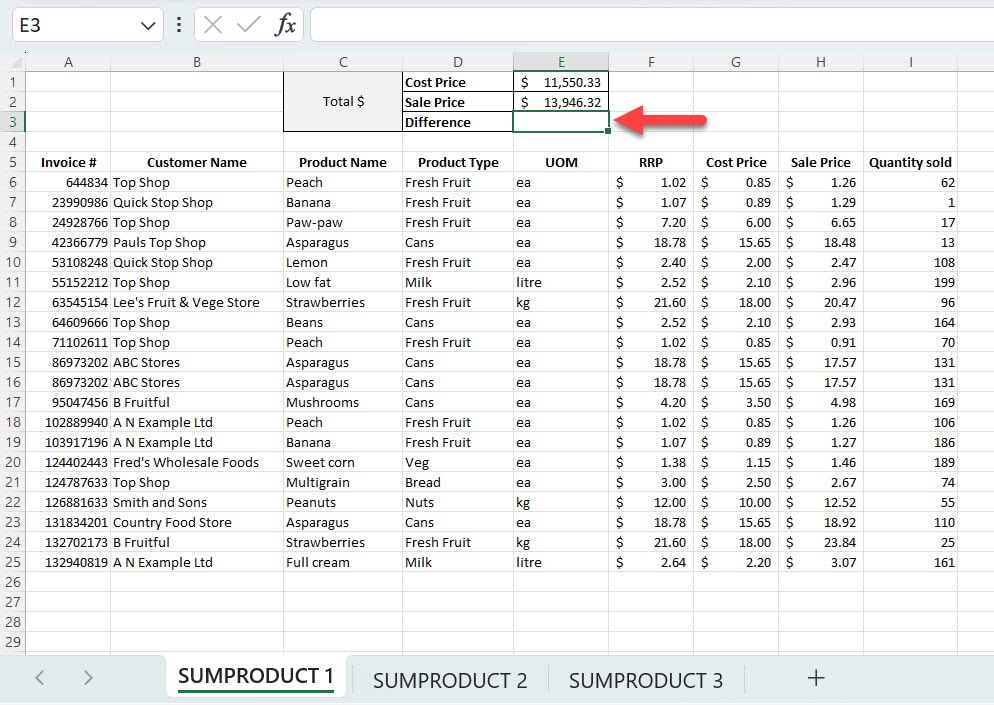
1. Open Excel. Start by opening the Excel spreadsheet containing your sales data. For this example, we opened the SUMPRODUCT spreadsheet.
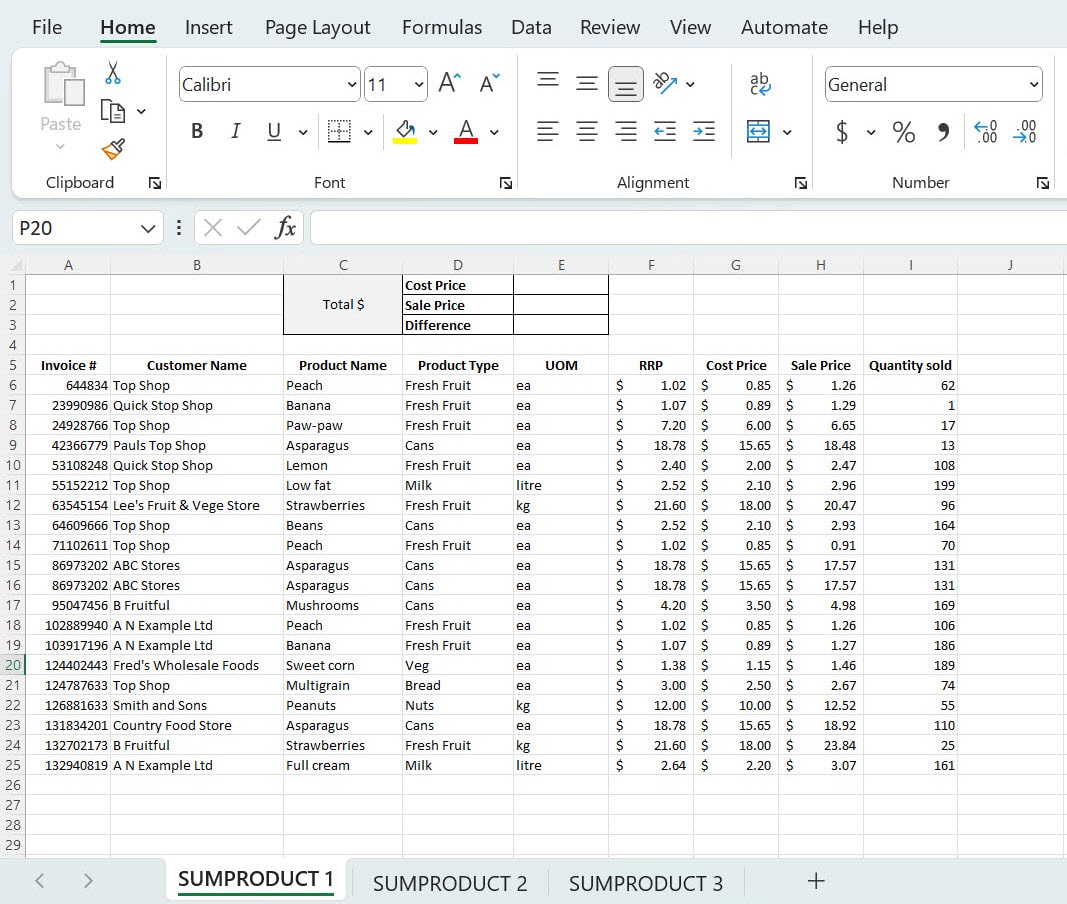
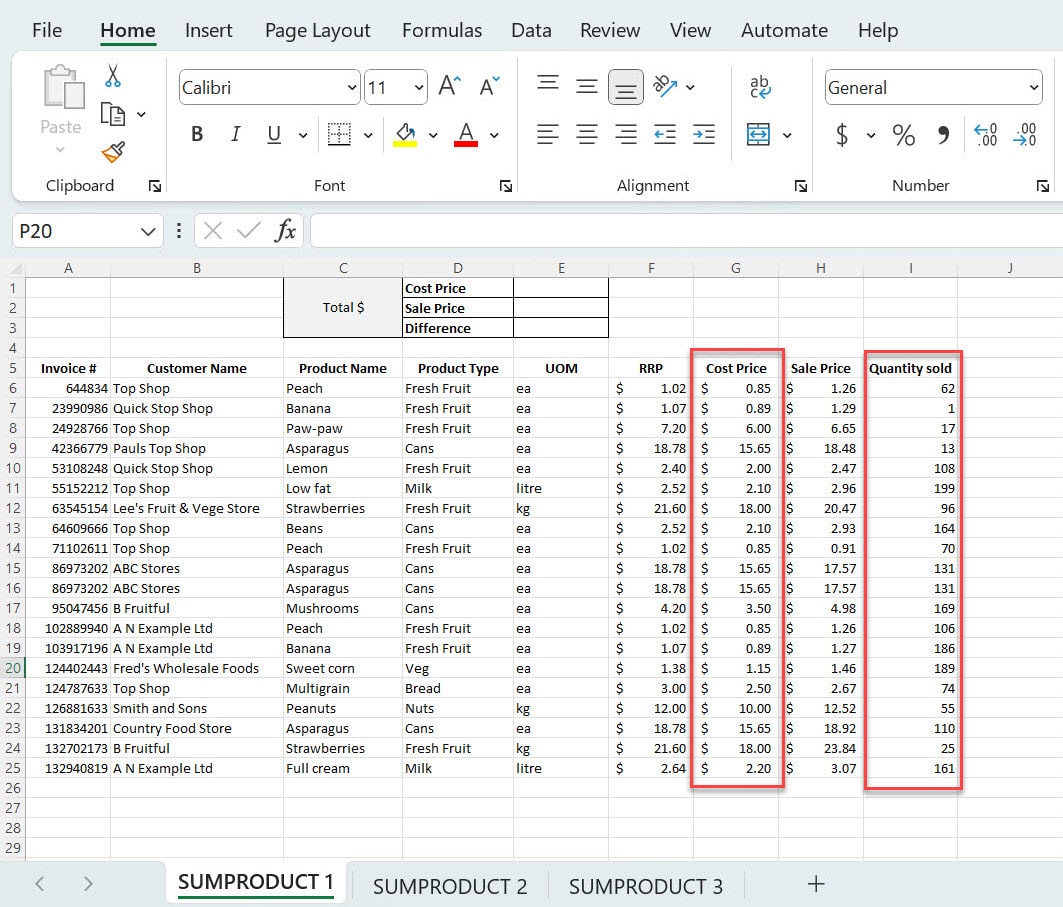
2. Identify the Ranges. Ensure you have a column for 'Cost Price' and another column for 'Quantity Sold'. Make sure these columns have data in the rows you're interested in. For this example, our ‘Cost Price’ column is column G (this holds the value of the cost of the item) and our ‘Quantity Sold’ values are in column I (these values represent how many times the item was sold).
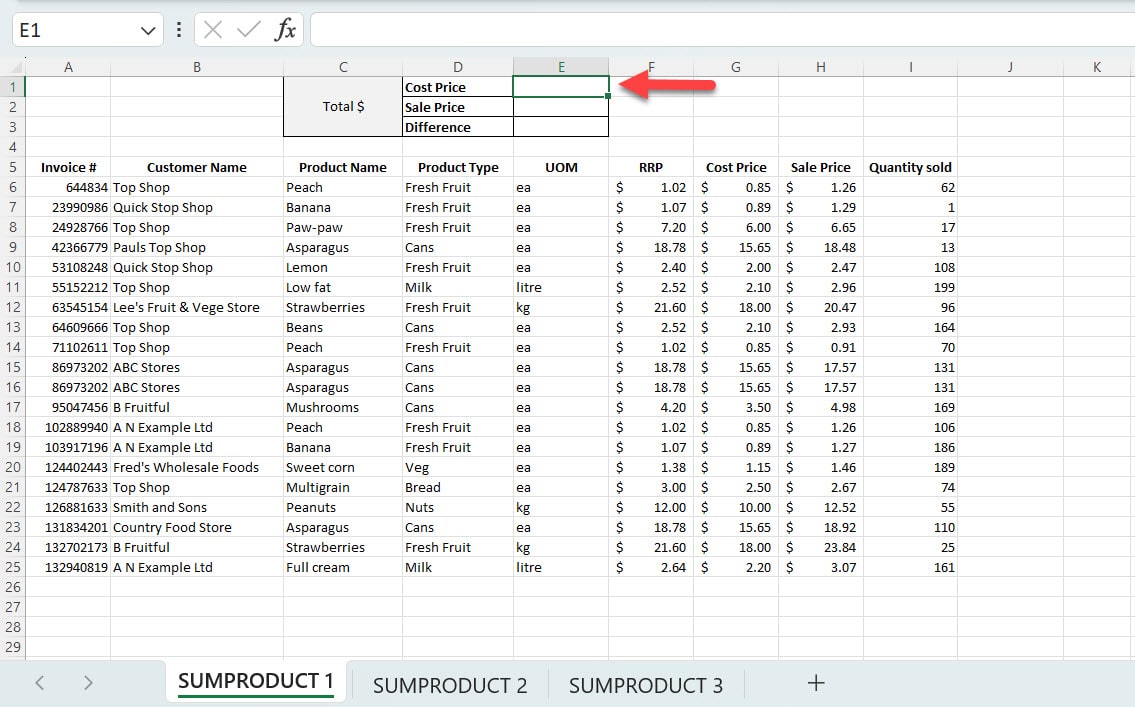
3. Select a Cell. Choose a cell where you want to display the total cost. For instance, let's use cell E1.
4. Enter the Formula. In cell E1, enter the following SUMPRODUCT formula:
=SUMPRODUCT(G6:G25, I6:I25)

In this formula, G6:G25 represents the range of cost prices, and I6:I25 represents the range of quantities sold. Adjust the ranges as per your actual data.
Note: In our example, the values in column G are being multiplied by column I and added to the sum. For example, the value in cell G6 ($0.85) is being multiplied by the value in cell I6 (62) and this value is being added to the sum value in cell E1. This pattern continues down the range of data to give you the total sum value (total).
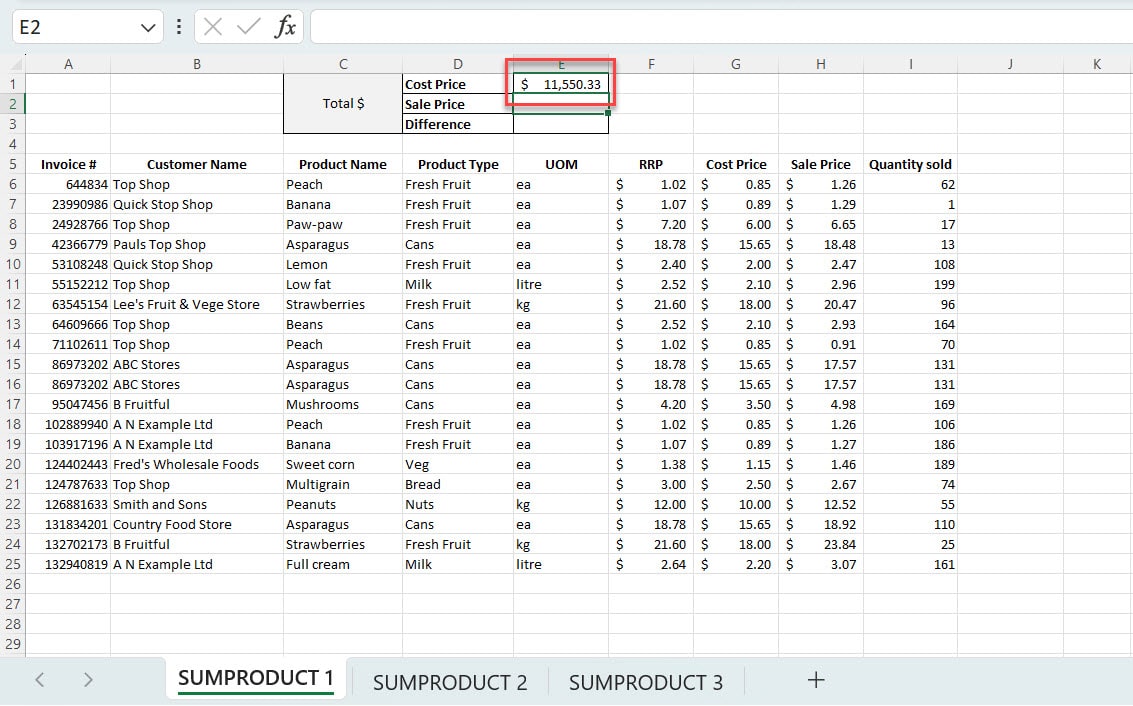
5. Press Enter. After entering the formula, press Enter. Excel will perform the necessary calculations and display the total cost for all sales in the selected range.
Create a SUMPRODUCT formula using the Function Arguments box to calculate the Sales Price
Now that we've calculated Total Cost Price using SUMPRODUCT, we can use the same process to total another columns sum. However, we want to show you another way you can easily create a SUMPRODUCT formula. In this method we will be using the Function arguments box.
For example, we will look at how to total the Sale Price columns data in from column H by multiplying it by the Quantity sold in column I.
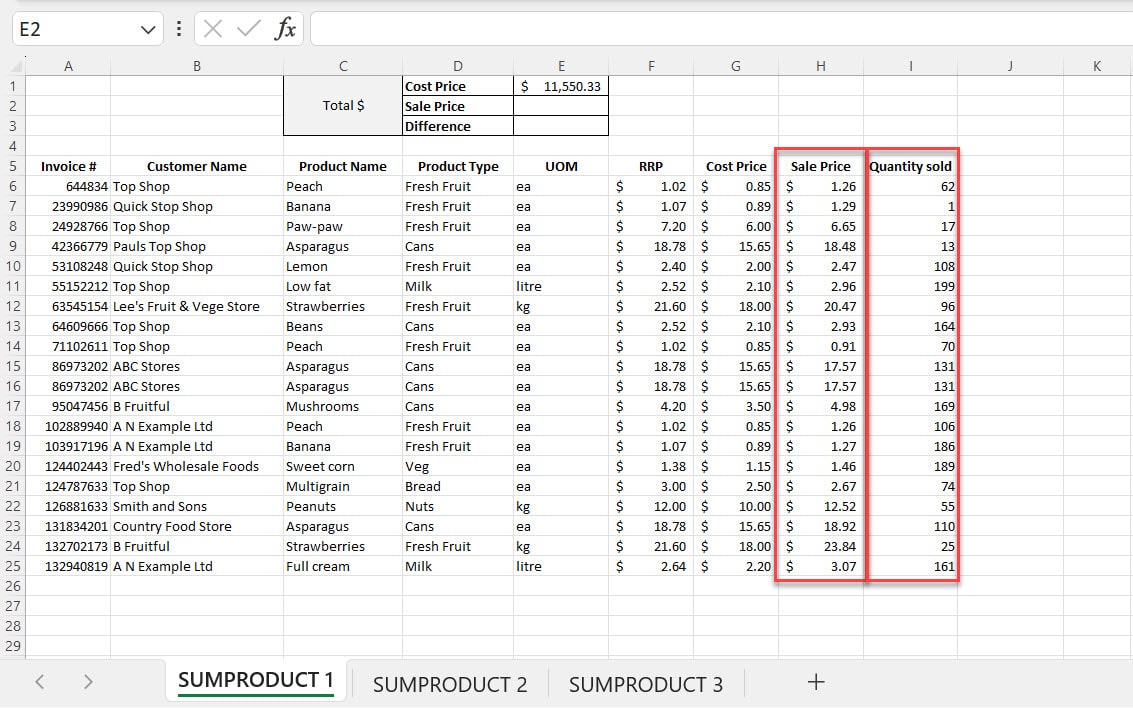
1. Select another cell (for example, E2). This will be the cell in which the total sum of the Sale Price will be displayed.
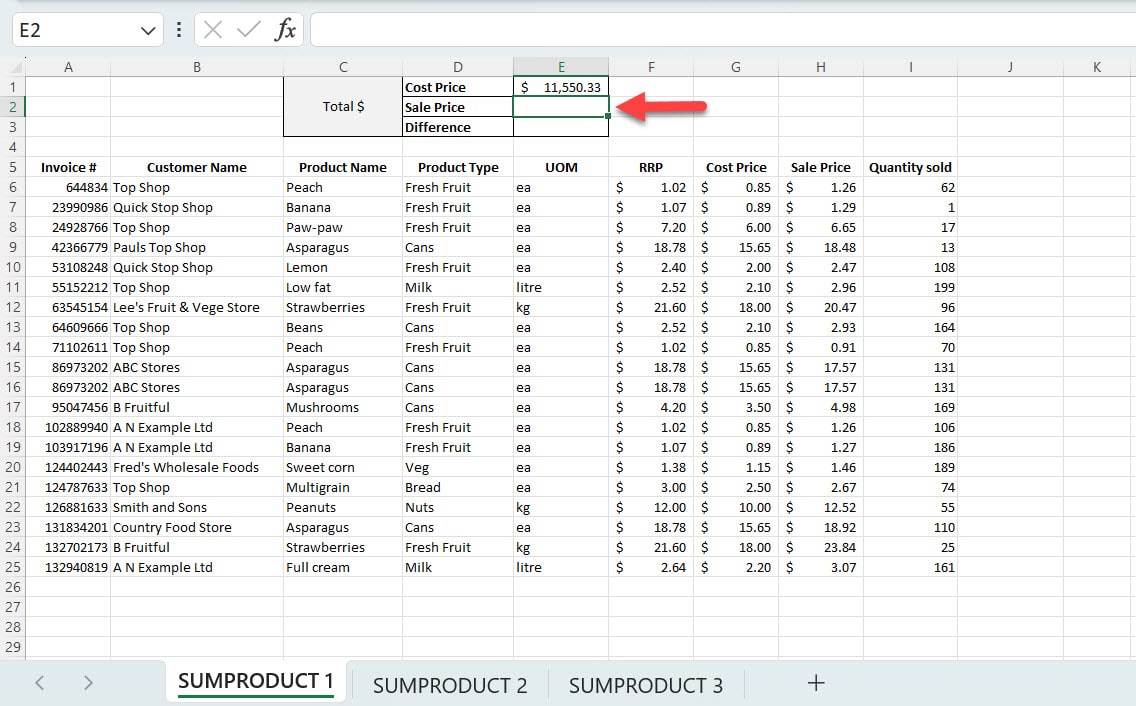
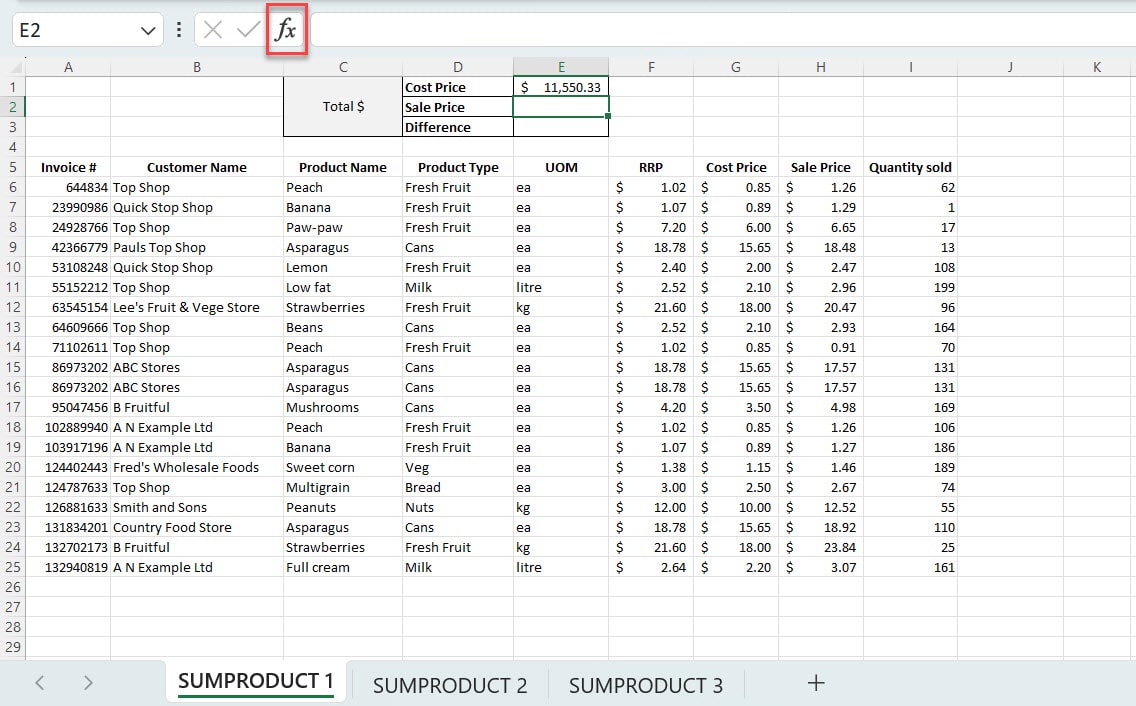
2. Click the fx (formula) button next to the formula box.
3. Find the SUMPRODUCT option in the Select a function: field.
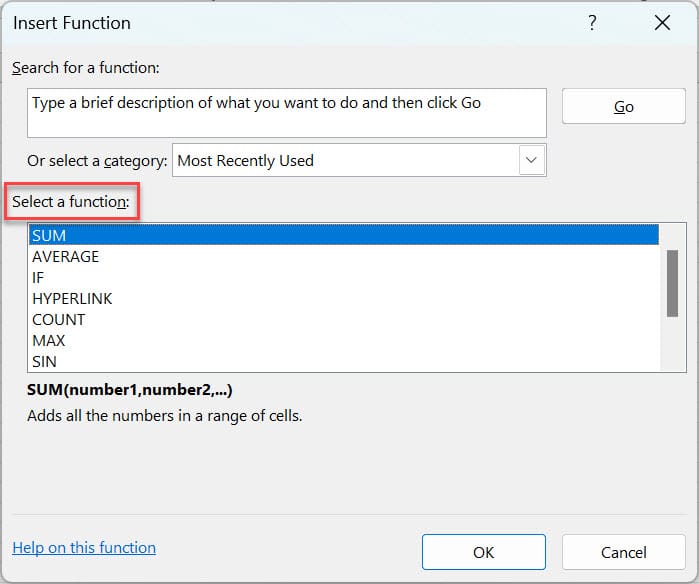
Note: If you cannot find SUMPRODUCT in the Select a function: field, you can type it into the Search for a function: box. Then select Go.
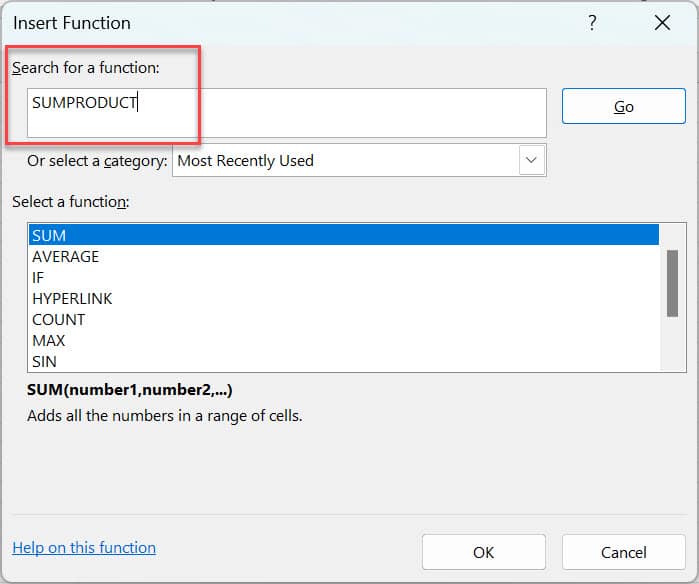
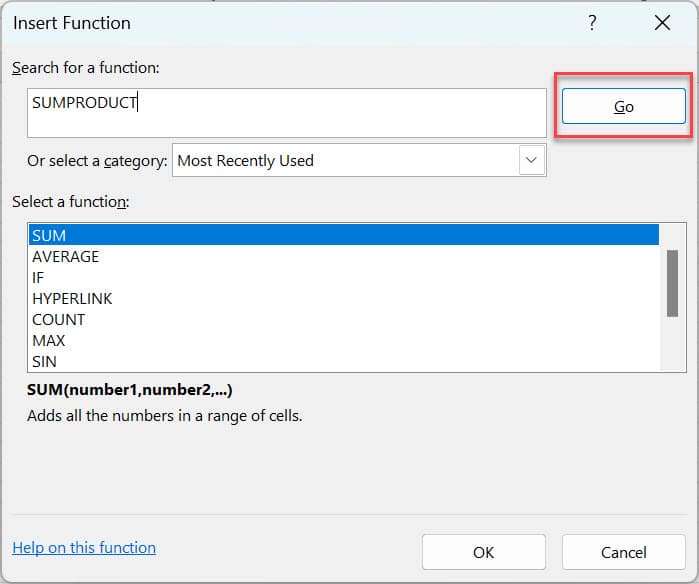
4. Select OK.
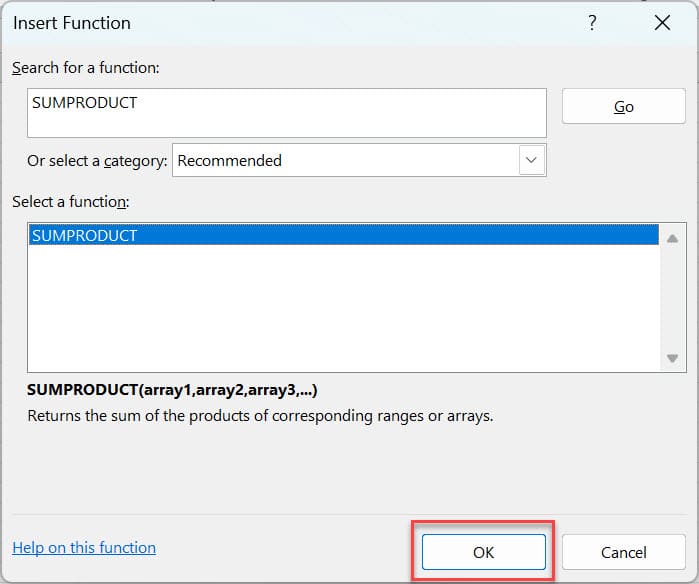
A Function Arguments box should have appeared.
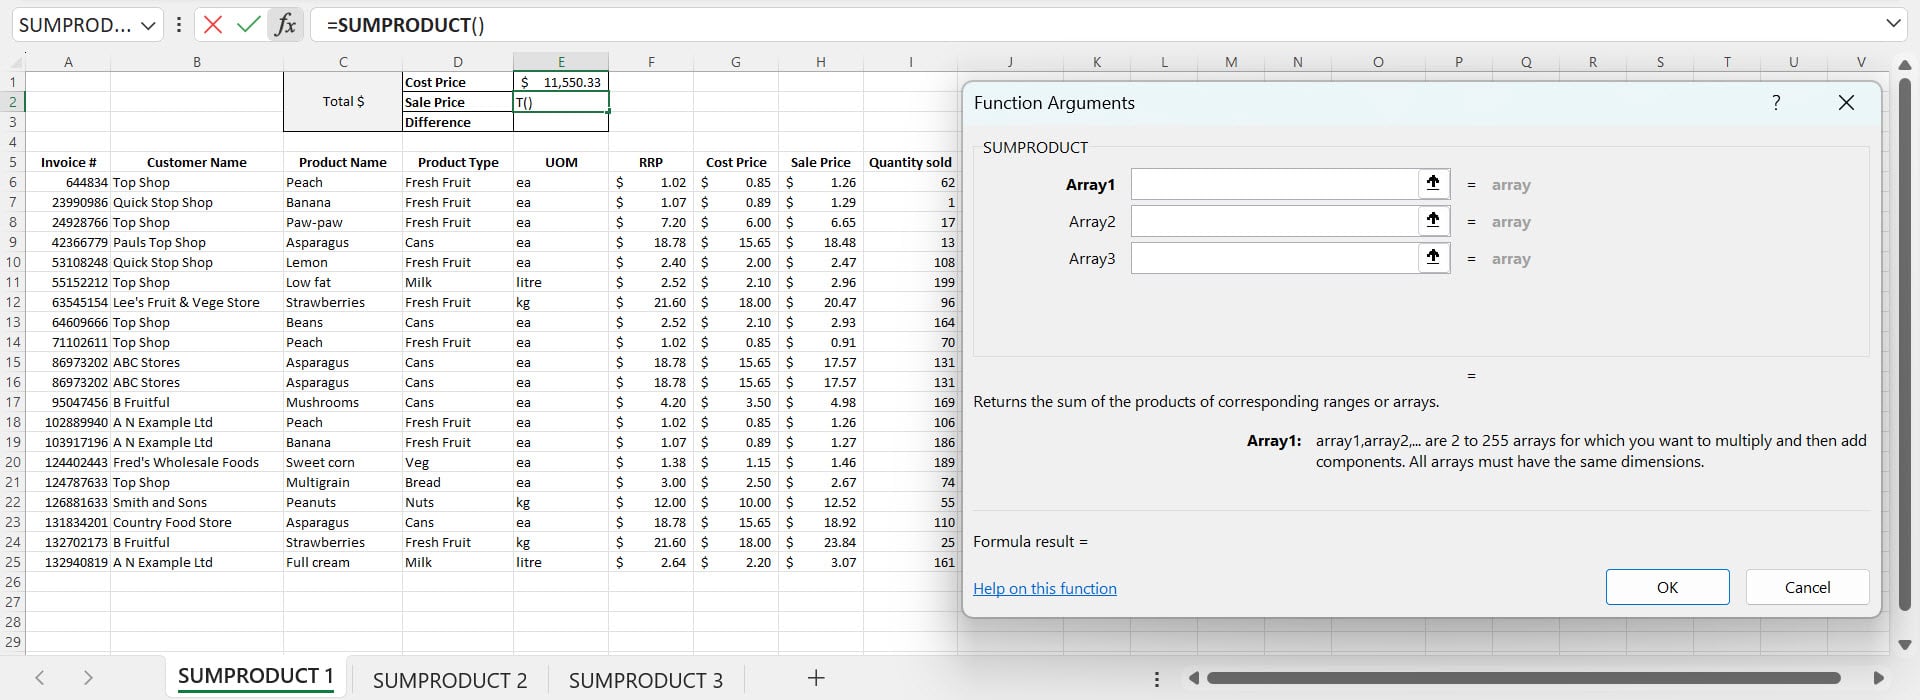
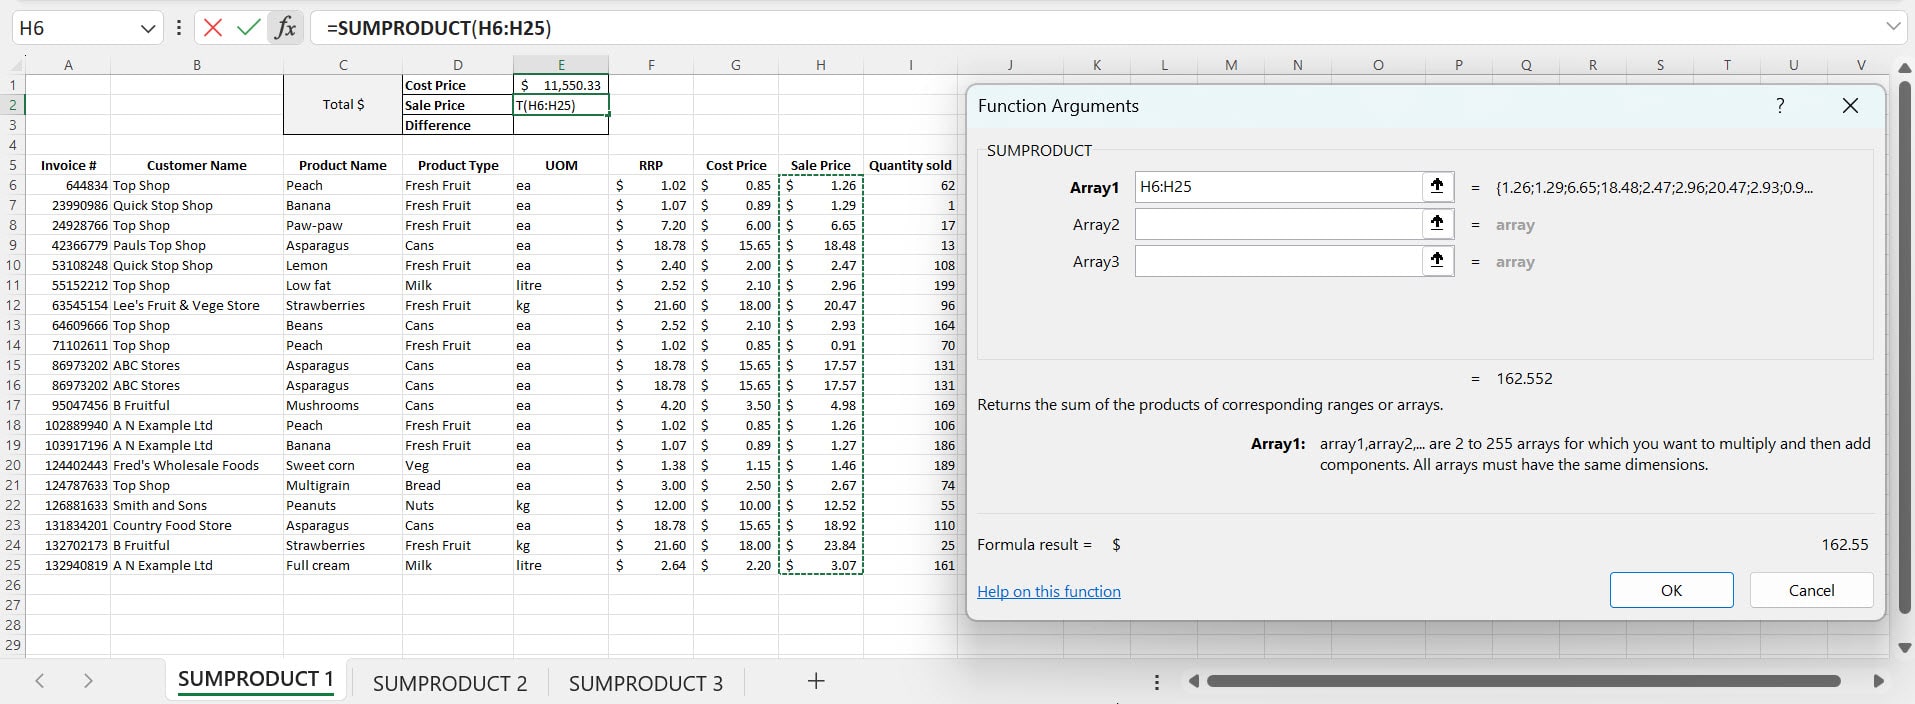
5. While clicked into the Array 1 box, click and drag your mouse over the range for the Sale Price. In this example, that’s cells H6 to H25.
6. For the second Array, while clicked into the Array 2 box, click and drag your mouse over the range for the Quantity Sold. In this example, that’s cells I6 to I25.
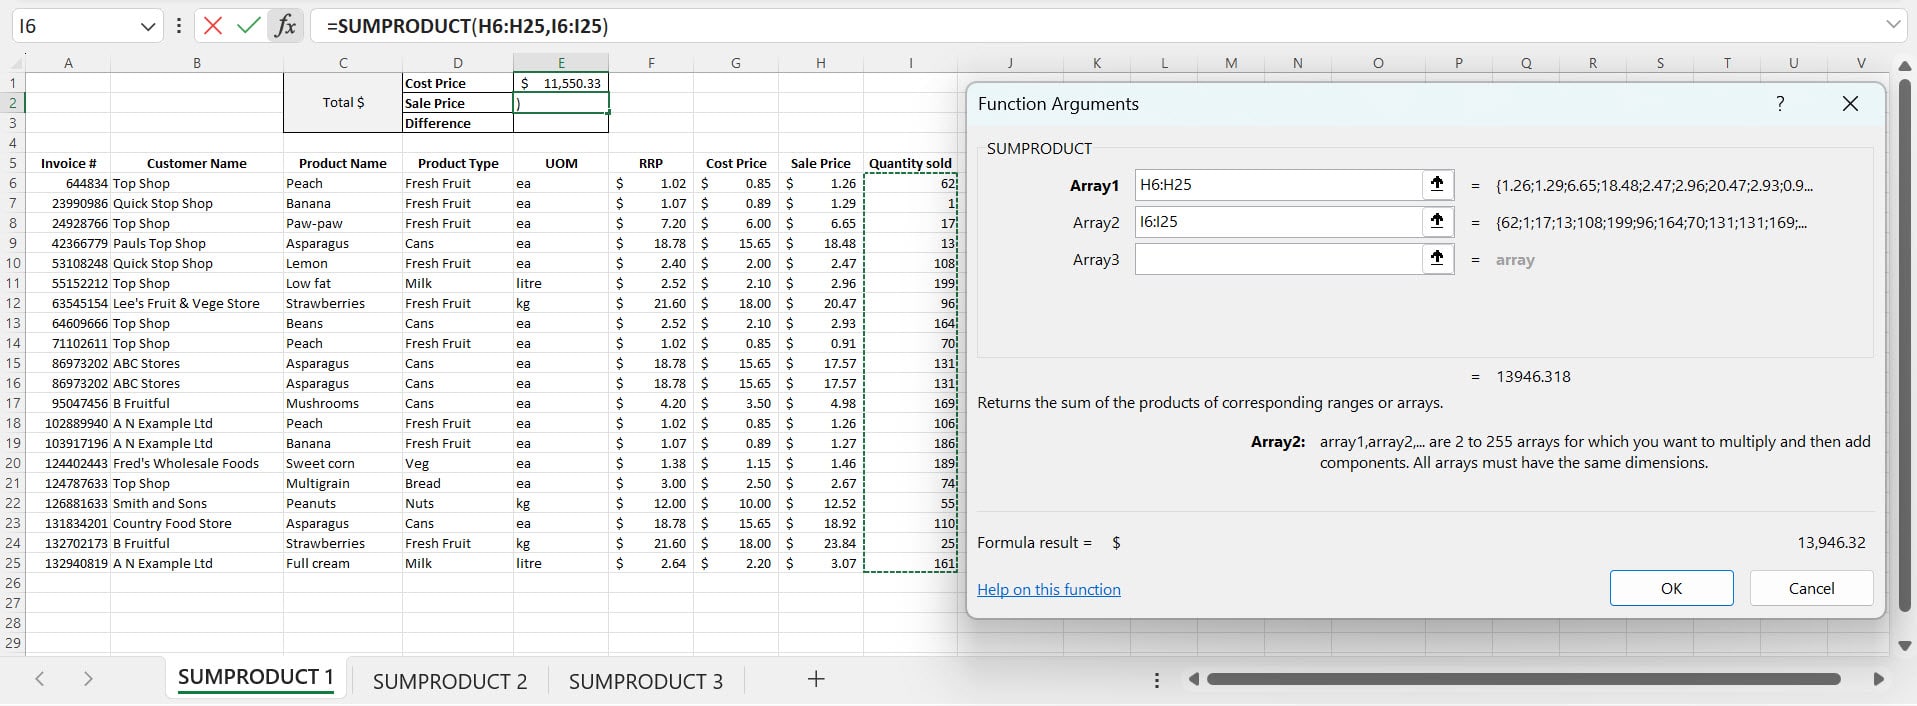
Note: Always make sure the Arrays have the same dimensions e.g. the selected ranges must start and end at the same row.
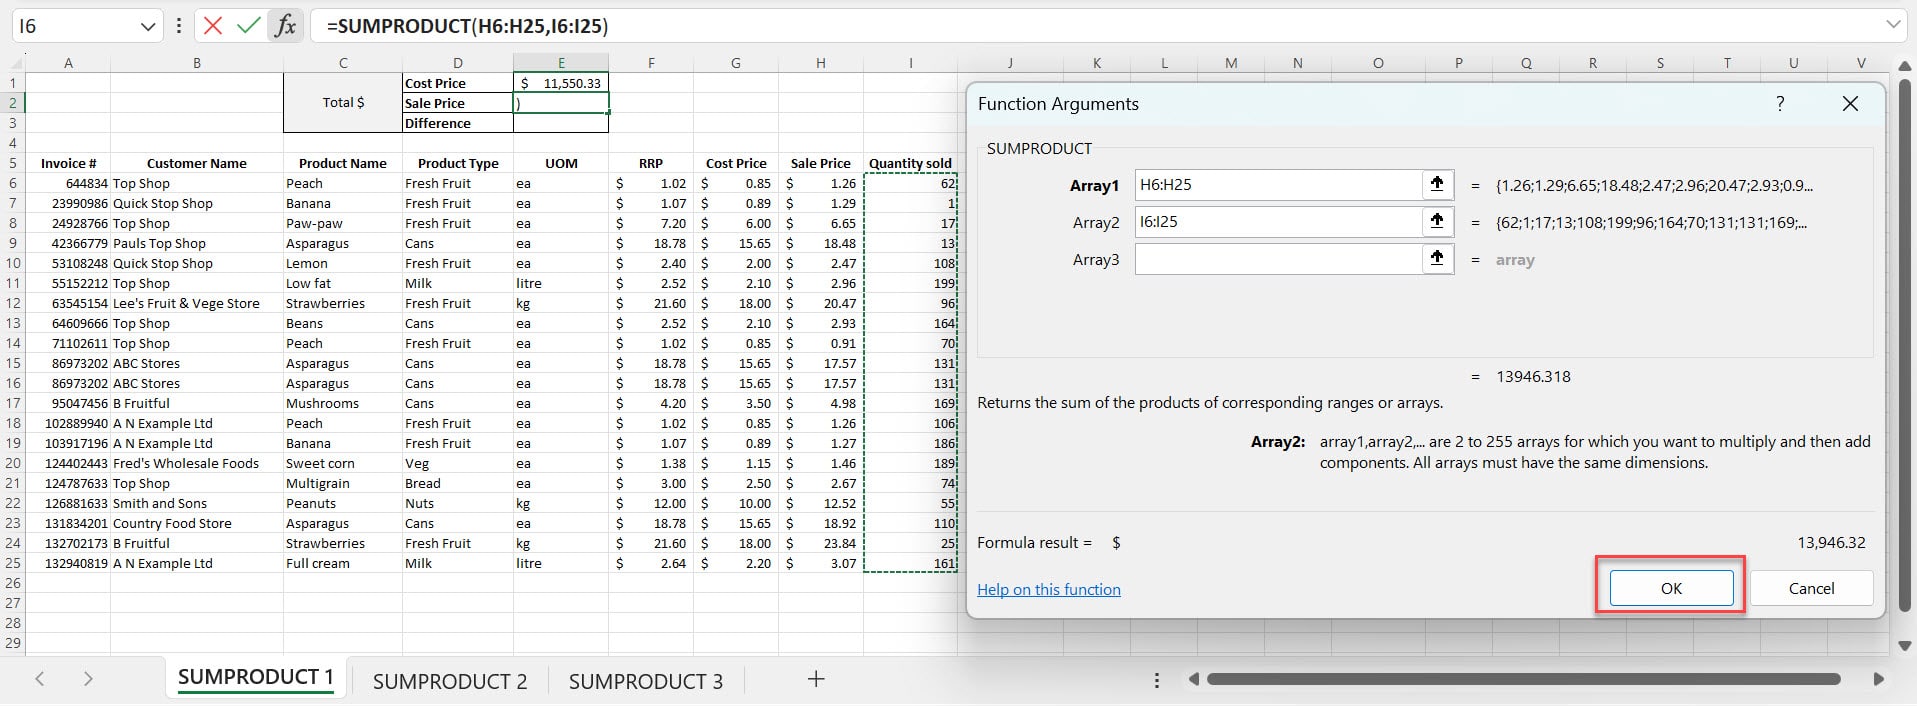
7. Click OK.
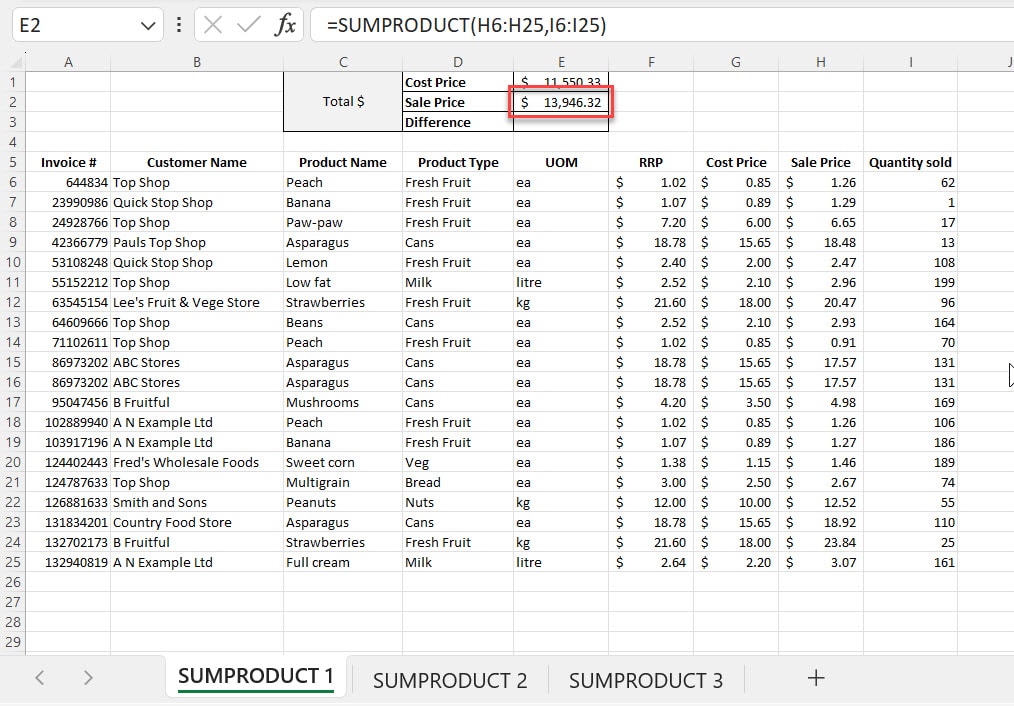
The Sale Price total sum should now be displayed in cell E2.
Calculating the difference between Cost Price and Sales Price
Now that we have used SUMPRODUCT to calculate the Total Cost Price and the Total Sales Price, we can find the difference between the two.
Calculating the Difference
To find the difference between the total sale price and the total cost:
1. Select a cell (e.g., E3).
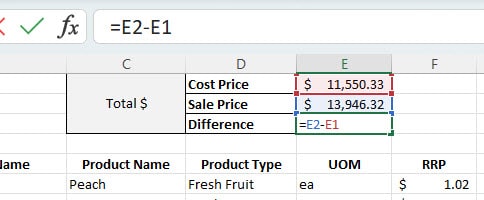
2. Enter the formula: =E2-E1 (assuming E2 contains the total sale price and E1 contains the total cost).
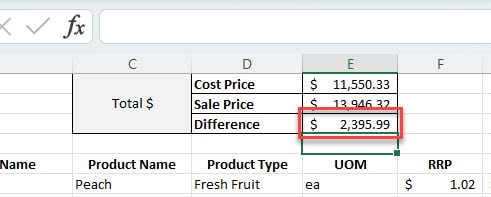
3. Press Enter to calculate and display the difference.
SUMPRODUCT formula in Excel: Example 1
In this example, we have a spreadsheet showing how many litres of a particular product a company has in stock. The amount of litres of the product can be seen in cells C4, D4, E4, F4 and G4 and the amount of product in stock is in columns C-H rows 5-14. The total litres available is seen in column H.
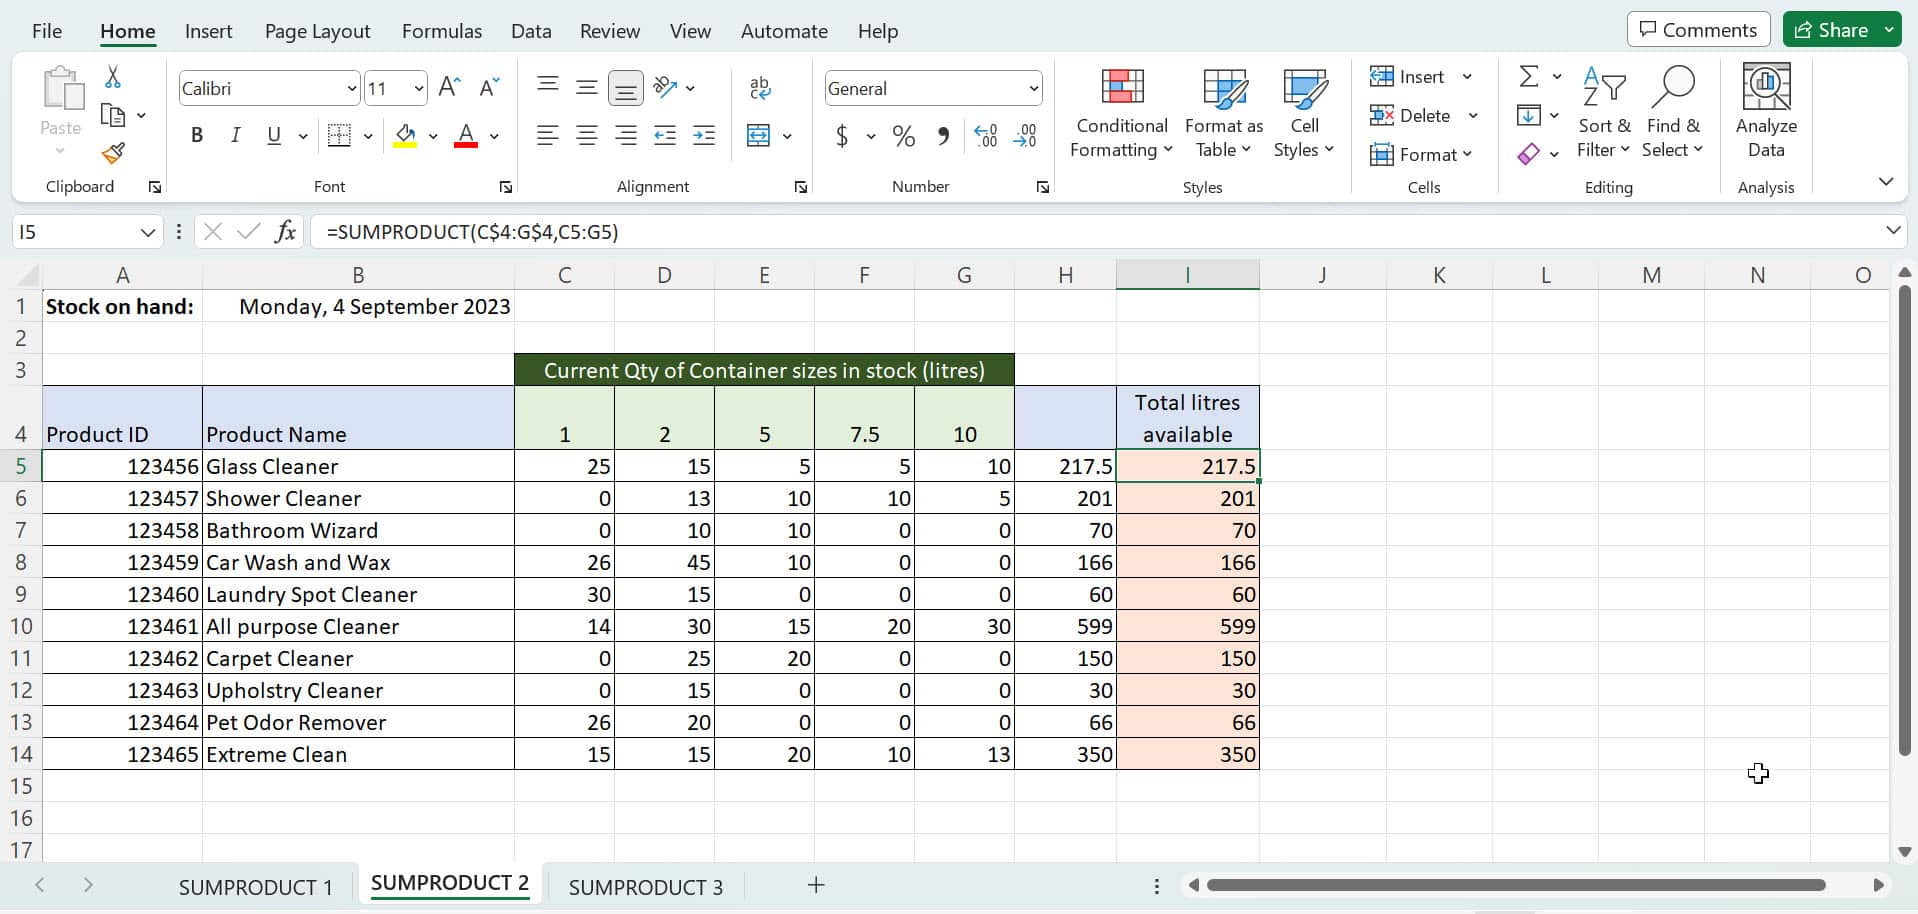
Upon inspection, it can be seen that whoever created this spreadsheet also created an extensive formula to calculate the total litres which can be seen in column H.
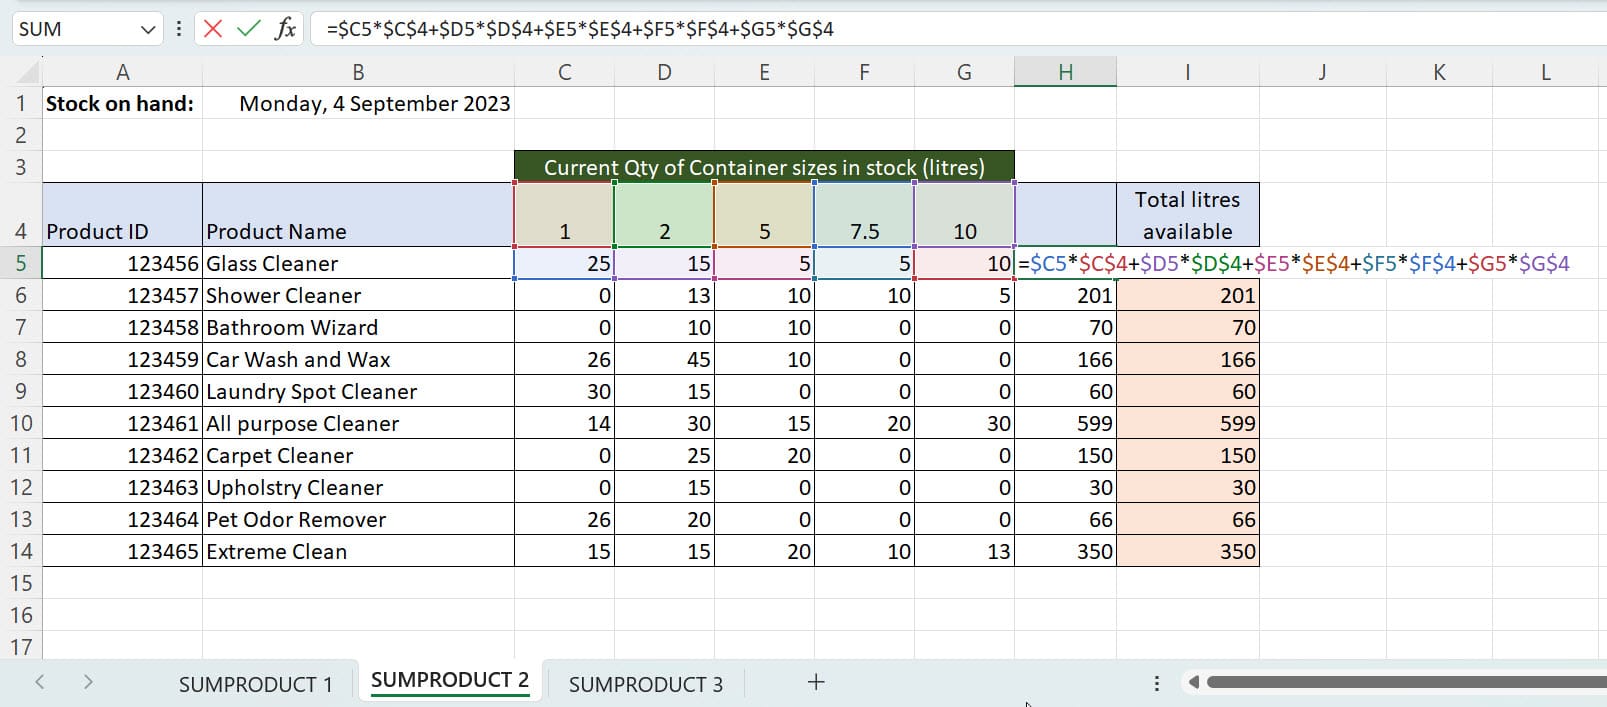
The formula created multiplied the amount of the items they had in stock (seen in row 5) by the number of litres of each individual product (seen in row 4). The total column ended up with the formula = $C5*$C$4+$D5*$D$4+E5*$E4+$F5*$F$4+G5*$G$4
While this formula does in fact work, it is very messy and also requires a lot of time to set up.
This is where SUMPRODUCT comes in, it saves so much time as you are able to select the ranges of what you want to total. In this example, we created the formula =SUMPRODUCT(C$4:G$4,C5:G5) in cell I6 and we copied this down the column.
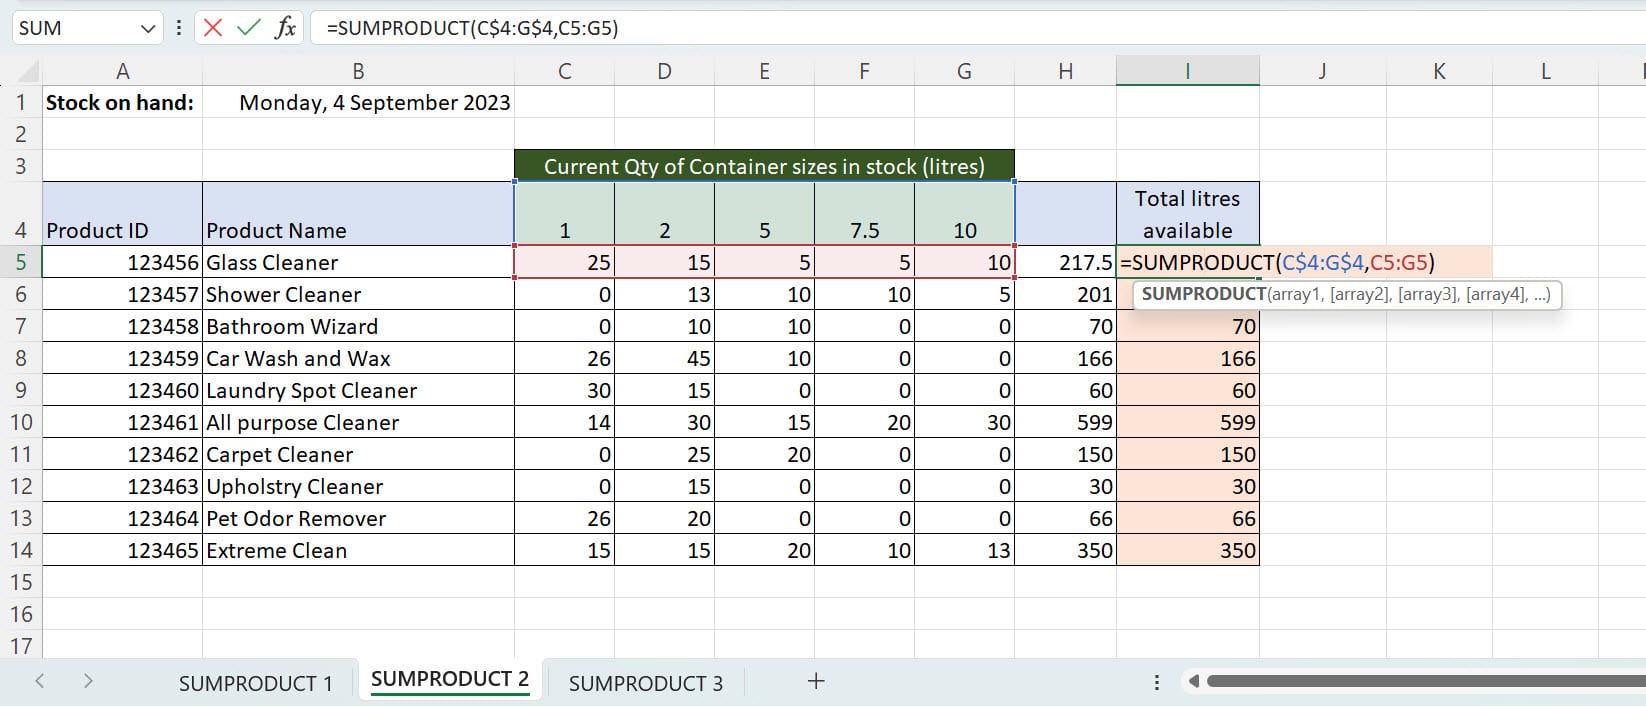
This formula is multiplying the size of the product in litres (cells C4-G4) by the amount of items in stock (cells C5-G5). The $ have been added to the formula (between the C and 4, and the G and 4) so that when the formula is copied the reference to the quantities row doesn’t creep.
Using SUMPRODUCT in this example allows for a quicker and easier creation of the formula.
SUMPRODUCT Formula in Excel: Example 2
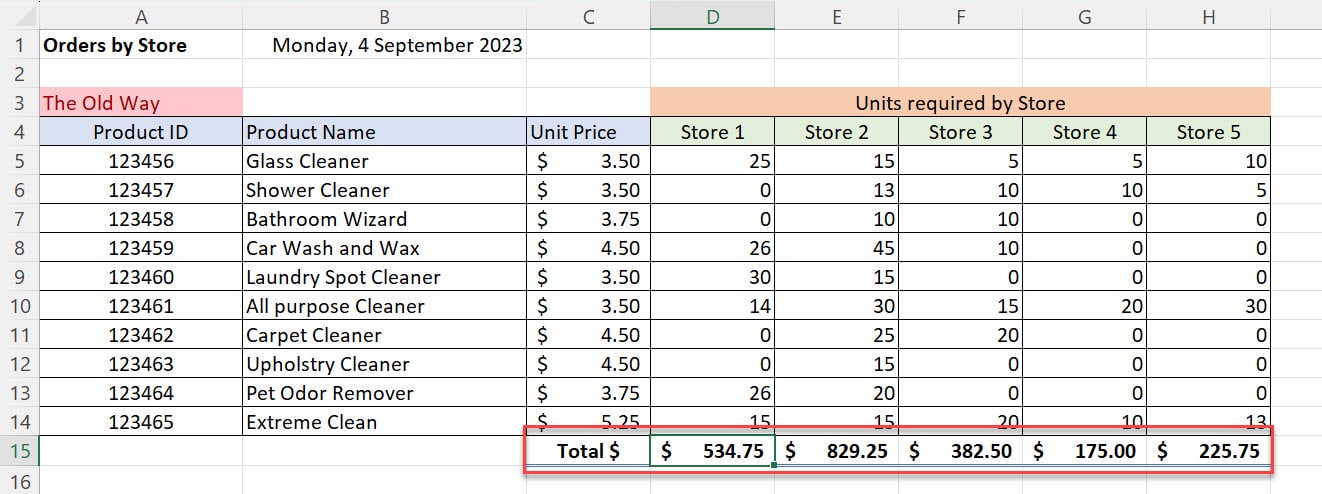
In this example, we have a spreadsheet of a client who has multiple stores they buy for. The worksheet collates purchases for all stores into one sheet. The unit price for what they are selling can be seen in column C and the stores they are selling to are in columns D, E, F, G and H.
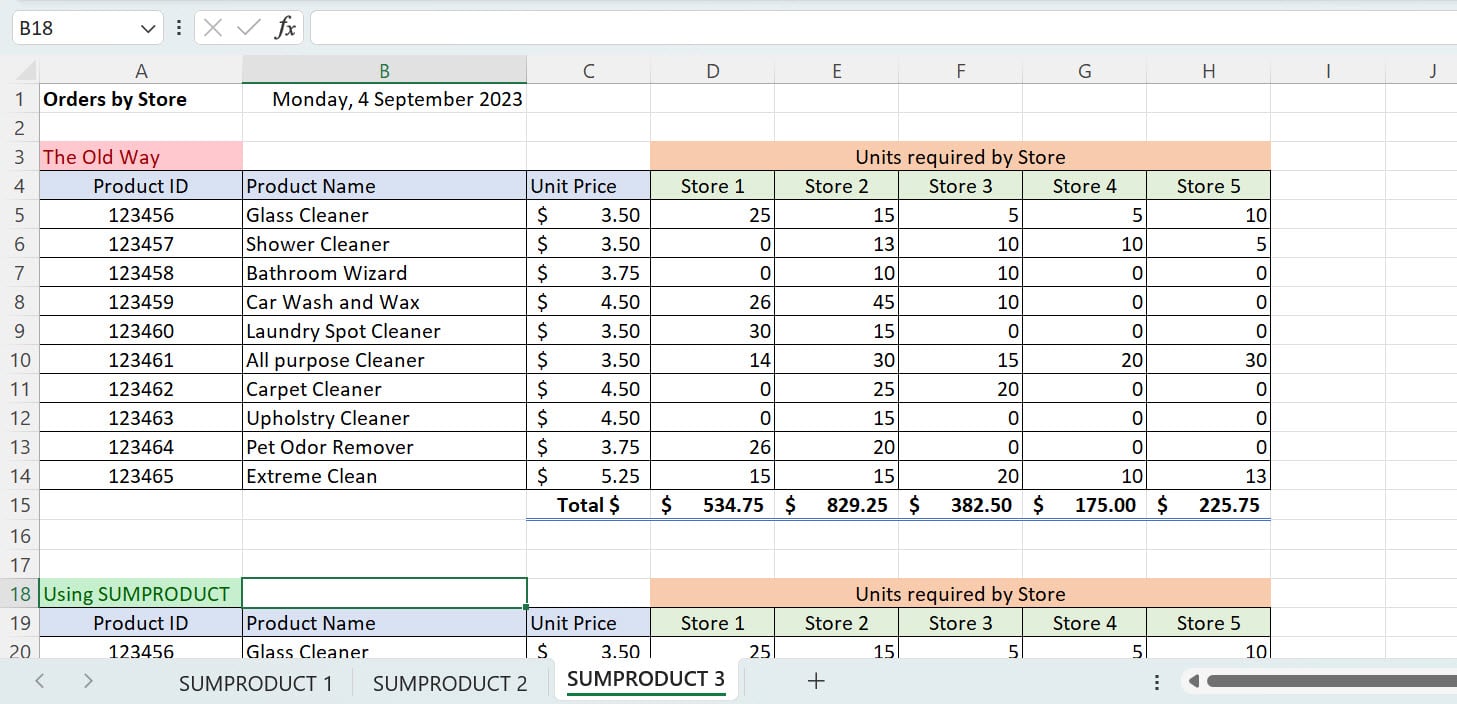
Similar to the first example, this spreadsheet’s total sum (in row 15 of cells D, E, F, G and H) is super extensive and messy. The formula =$C5*D5+$C6*D6+$C7*D7+$C8*D8+$C9*D9+$C10*D10+$C11*D11+$C12*D12+$C13*D13+$C14*D14 is used to calculate the total.
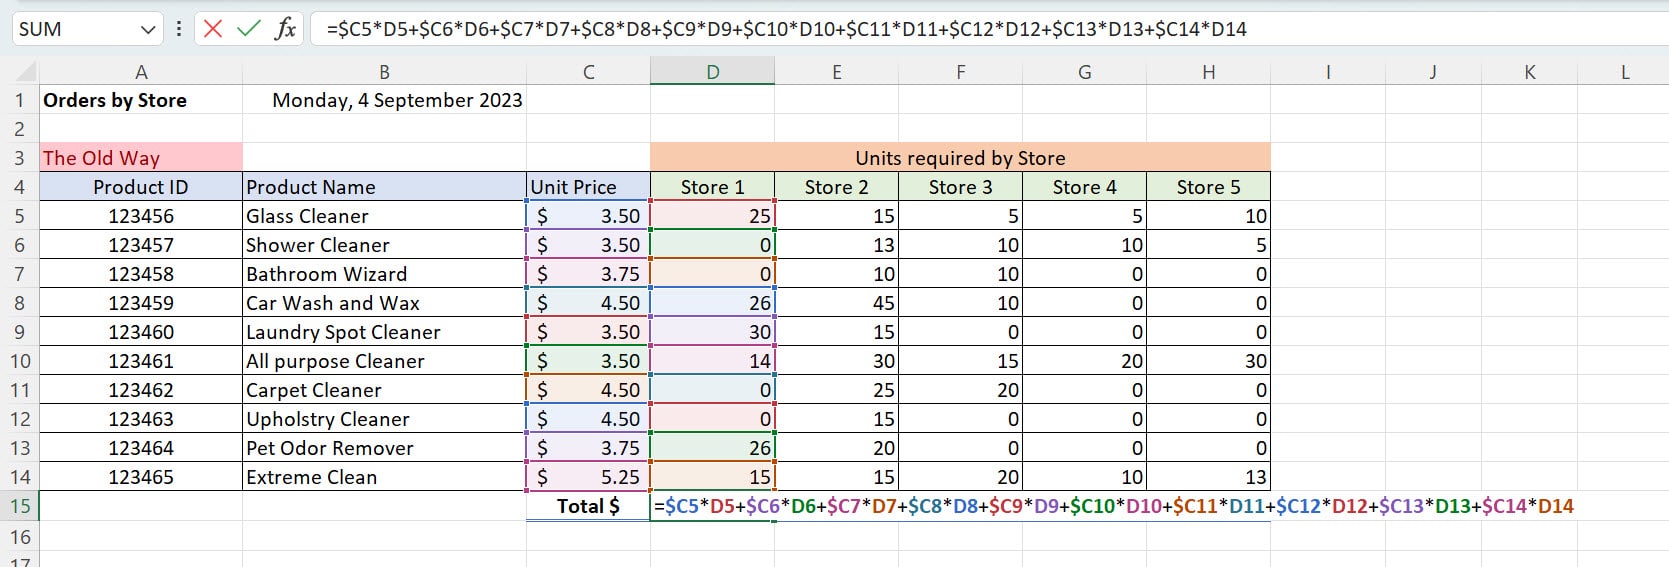
In our example, using SUMPRODUCT makes this calculation more streamlined and easier.
By using the formula =SUMPRODUCT($C20:$C29,D20:D29) in the total cell at the bottom of the column and then clicking and dragging this formula along the row, all of the totals for each store are quickly and easily summed.
Conclusion
In conclusion, the SUMPRODUCT function is a valuable tool in Excel for performing complex calculations involving multiple arrays or ranges of data. It enables you to multiply corresponding values and then sum up the results, all in a single formula. By following the steps outlined in this blog post, you can harness the power of SUMPRODUCT for efficient data analysis in your Excel spreadsheets.
Was this post helpful? Let us know in the Comments below.

